WoW64 Process - POV from kernel
Have you ever wondered how your 64-bit Windows system manages to run those old 32-bit applications seamlessly? The instructions aren’t the same, the addresses, the page sections and many of 32-bit structures can’t be directly accessed by a 64-bit process, which differentiates the two.
Thanks to WoW64 (Windows 32-bit on Windows 64-bit) implemented in all 64-bit versions of Windows. This subsystem acts like a compatibility layer between the 32-bit app and the 64-bit OS. It essentially acts as a very specific emulator, mapping 32-bit addresses in Virtual Memory. Here’s more details about the emulation method.
By creating a simple 32-bit application, the layer become visible due to three modules loaded into our process.
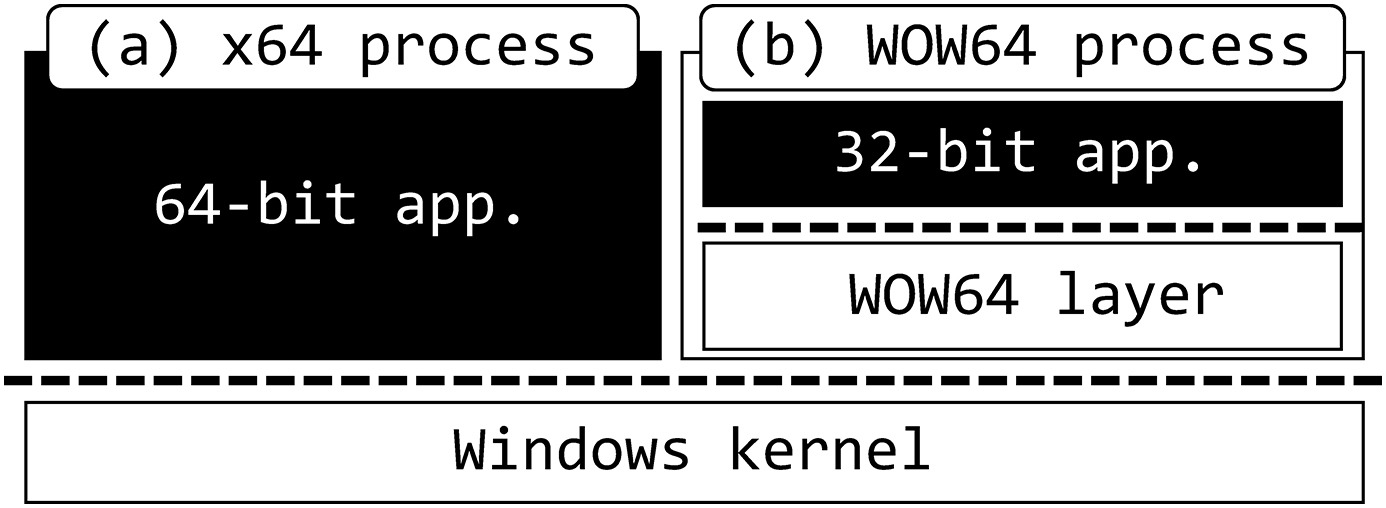
Here is a representation of a x64 Windows app and a WoW64 app.
 (This article really helpend our research)
The Kernel problem
Let’s switch to the other side. In this scenario, We are running within the application context, which means we can access the mapped virtual memory directly from the kernel.
The goal here is to read sensitive information from the 32-bit app, in our case, the StackTrace.
1
2
3
4
5
6
7
8
9
10
11
12
13
14
15
// [...] Worker item routine
PEPROCESS CurrentProcess;
PETHREAD CurrentThread;
PNT_TIB nt_tib64;
CurrentProcess = pContext->Eprocess; //Getting EPROCESS*
CurrentThread = pContext->CurrentThread; //Getting ETHREAD*
KeStackAttachProcess(CurrentProcess, &ApcState); //Get inside the process context (Work items run in System context by default.)
//dont forget KeUnstackDetachProcess at the end

nt_tib64 = *(PNT_TIB*)((PUCHAR)CurrentThread + 0xf0);
DbgPrintEx(0,0,"StackBase: 0x%p\nStackLimit: 0x%p\n",
    nt_tib64->StackBase,
    nt_tib64->StackLimit
    );
// [...]
In this piece of code, we retrieve the StackBase and StackLimit of the Process located in the NT_TIB structure (which has the same offset as the TEB)
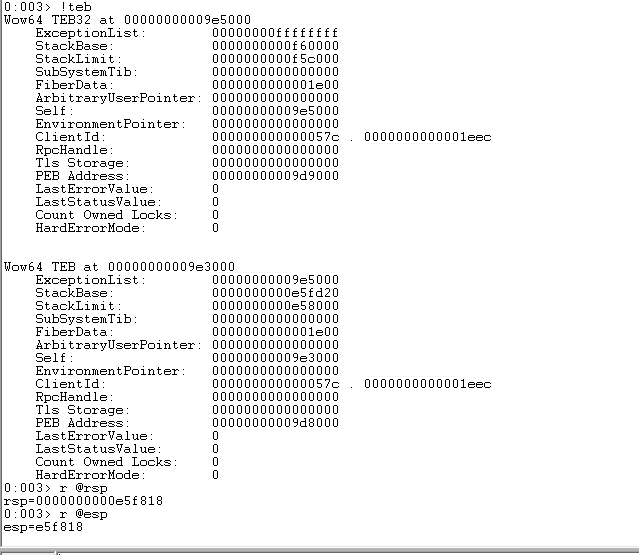
By doing this, we encounter the same problem as WinDbg (WinDbg implements the debug of the WOW64 process; which is why we have two TEB). In our driver example, we currently only have access to the second TEB, which represents the WOW64 environment. We are debugging the emulator itself! 
The Kernel solution
Resolving this kind of problem can indeed be quite painful. Many internal Windows structures are opaque, and the research behind them may not be documented. However, all the sources will be available in the end.
Getting the 32 bit process context
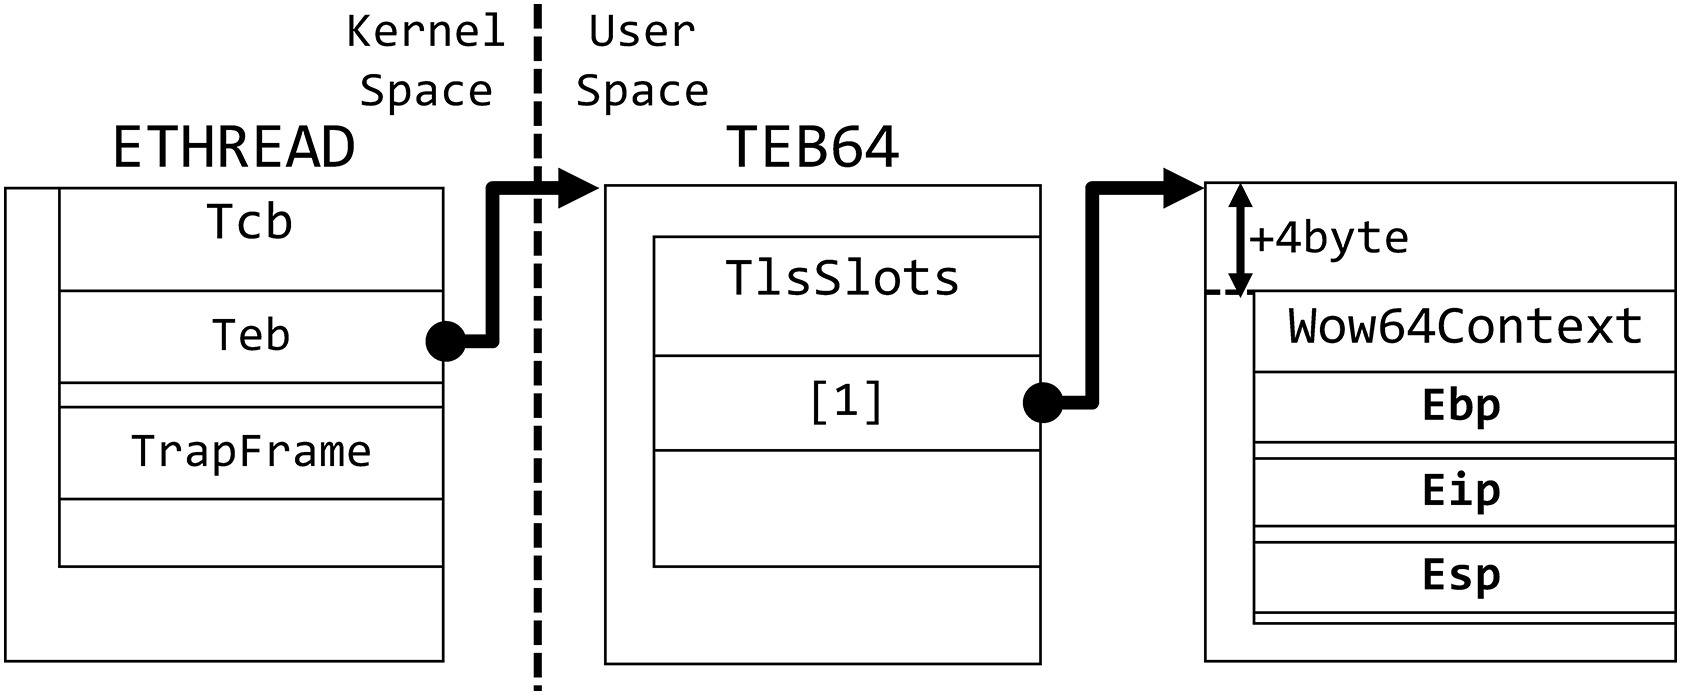
To get the context of a 32-bit process, instead of using the KTRAP_FRAME structure, the (emulated) registers by WoW64 are located in the provided image :
The Thread Local Storage Slot array is opaque and not documented; Although some code can assist in understanding it , a significant portion of this array consists of NULL pointers.
1
2
3
4
5
typedef struct _WOW64_CONTEXT_FROM_TLS {
	BYTE padding[4];
	WOW64_CONTEXT context;
} WOW64_CONTEXT_FROM_TLS;
typedef WOW64_CONTEXT_FROM_TLS *PWOW64_CONTEXT_FROM_TLS;
1
2
3
4
5
6
7
8
PWOW64_CONTEXT_FROM_TLS WowContext;
// [...]
WowContext = *(PWOW64_CONTEXT_FROM_TLS*)((PUCHAR)Teb + 0x1480 + (sizeof(UINT64) * 1));
DbgPrintEx(0, 0, "ContextFlag 0x%X EBP : 0x%X EIP: 0x%X ESP: 0x%X\n",
    WowContext->context.ContextFlags,
    WowContext->context.Ebp,
    WowContext->context.Eip,
    WowContext->context.Esp);
In this code, we apply the diagram above, firstly we have the TEB of the layer (the one we don’t care about), then we add 0x1480 (The current offset of the TlsSlots), and finally we are reading at the Second element of the TlsSlots array.
To simplify, we could write the operations as WowContext = *(PWOW64_CONTEXT_FROM_TLS*)Teb.TlsSlots[1];
Once we have the good offset, we are fully able to read the registers state of the 32 bit application.
Getting the StackLimit & the StackBase
As mentioned earlier, the StackBase and StackLimit pointer are located in the NT_TIB structure, which is located at TEB+0x0
Additionally the WoWTebOffset located in the WOW64 TEB+0x180C gives the offset we need to add to the current TEB to access the TEB32 structure of the 32-bit application context.
1
2
3
4
5
6
WowTebOffset = *(UINT32*)((PUCHAR)Teb + 0x180C);
DbgPrintEx(0, 0, "WowTebOffset: %X\n", WowTebOffset);
PNT_TIB32 WoW64NTTIB = *(PNT_TIB32*)((PUCHAR)Teb + WowTebOffset);
DbgPrintEx(0, 0, "WoW64Teb: %p\n", WoW64NTTIB);
DbgPrintEx(0, 0, "StackBase: %p\n", WoW64NTTIB->StackBase);
DbgPrintEx(0, 0, "StackLimit: %p\n", WoW64NTTIB->StackLimit);
When the app we are looking is a layer for a 32 bit process, the offset of the 32 bit TEB is located at the TEB+0x180C, if not, the value at this offset is just 0.
Once we have the offset, we can access the TEB32 of our target process.
Getting the 32 bit Stack Trace
By employing the EBP chaining technique, we can now reconstruct the Stack Trace. However, some post-processing work will be required to symbolize the addresses.
1
2
3
4
5
6
7
8
9
10
11
12
13
14
15
16
17
18
19
20
21
22
23
24
25
26
27
28
void ScanStackx86(UINT32 ebp, UINT32 StackBase, UINT32 StackLimit) {
	UINT32 ReconstructedStack[MAX_STACK_COUNT] = { 0 };
	UINT32 RetAddr = 0;
	unsigned int StackIndex = 0;
	do
	{
		if (StackIndex == MAX_STACK_COUNT-1) {
			goto QuitStackTrace;
		}
		if (((ebp + sizeof(UINT32) <= (UINT32)StackBase - sizeof(UINT32)) && (ebp >= (UINT32)StackLimit) ) == FALSE){
			goto QuitStackTrace;
		}
		ReconstructedStack[StackIndex] = *(UINT32*)(ebp + sizeof(UINT32));
		RetAddr = ReconstructedStack[StackIndex];
		StackIndex++;
		ebp = *(UINT32*)(ebp);
	} while (RetAddr != 0);
	StackIndex--;
QuitStackTrace:
	UINT32 i = 0;
	DbgPrintEx(0,0,"StackTrace:\n");
	while (i < (StackIndex-1)){
		DbgPrintEx(0, 0, "%ld : %X\n",i, ReconstructedStack[i]);
		i++;
	}
	return;
    // Save or return the ReconstructedStack
}
Sources
A significant amount of work has been dedicated to understanding and analyzing the WoW64 process, with some researchers delving into the subject in much greater depth.
https://www.sciencedirect.com/science/article/pii/S1742287618300458
https://en.wikipedia.org/wiki/WoW64
https://terminus.rewolf.pl/terminus/
https://github.com/mic101/windows/
https://www.vergiliusproject.com
https://blog.xenoscr.net/2022/01/17/x86-Nirvana-Hooks.html

